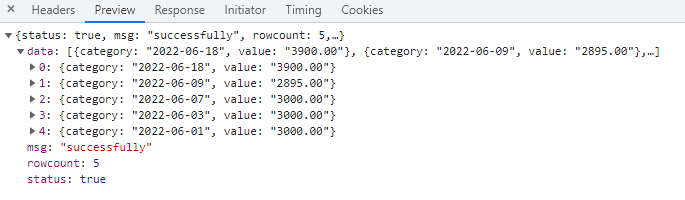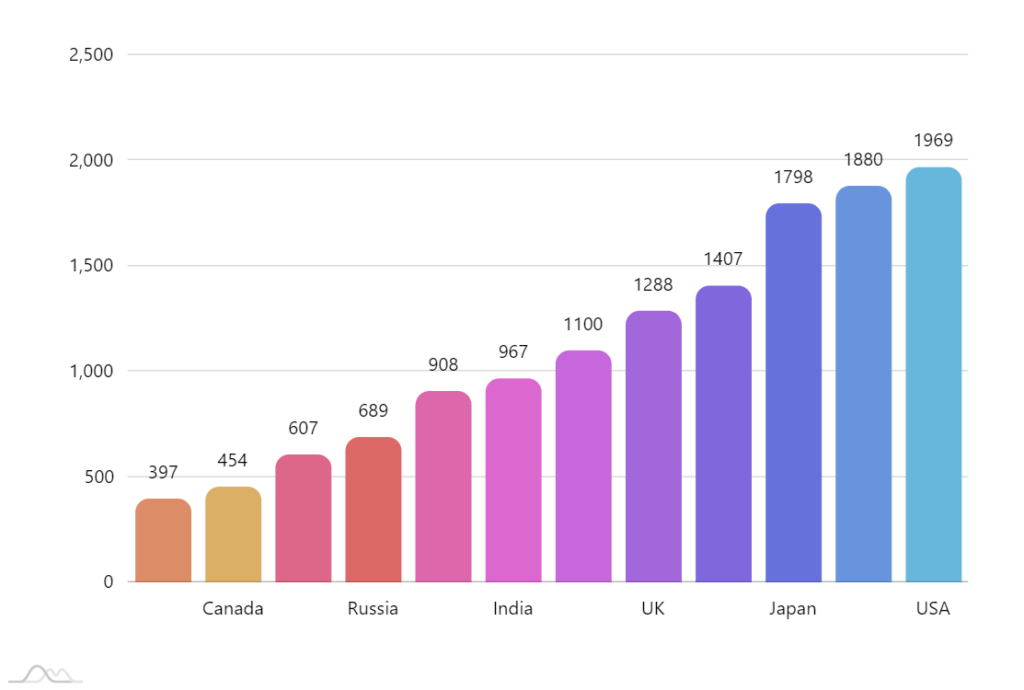
In this blog I make a call to the database, retrieve the results by converting it to a json format in PHP & then pass it to a graph to display.
Follow the steps to add a column chart dynamically on a webpage:
Step 1 : Start with a simple basic web page. Add a “div” element with the id “dynamic_chartdiv”:
<div id="dynamic_chartdiv"></div>Step 2 : Add css and Javascript library as below.
<!-- Styles -->
<style>
#chartdiv {
  width: 100%;
  height: 600px;
}
</style>
<script src="https://code.jquery.com/jquery-3.6.0.min.js" integrity="sha256-/xUj+3OJU5yExlq6GSYGSHk7tPXikynS7ogEvDej/m4=" crossorigin="anonymous"></script>
<script src="https://cdn.amcharts.com/lib/5/index.js"></script>
<script src="https://cdn.amcharts.com/lib/5/xy.js"></script>
<script src="https://cdn.amcharts.com/lib/5/themes/Animated.js"></script>
Step 3: Now create one function to get data from the database and also call that function while page load. You can change this as per your requirement.
<script>
$(document).ready(function(){
expense_report();
});

function expense_report()
{
	$.ajax({
	url:"https://app.shinerweb.com/index.php/chart/get_expense_report",
	type:"POST",
	dataType: 'json',
	success:function(response){
	if(response.status == true)
	{
	var html="";
	$("#dynamic_chartdiv").html('');
	$("#dynamic_chartdiv").html('<div id="chartdiv" ></div>');

	am5.ready(function() {
	// Create root element
	// https://www.amcharts.com/docs/v5/getting-started/#Root_element
	var root = am5.Root.new("chartdiv");

	// Set themes
	// https://www.amcharts.com/docs/v5/concepts/themes/
	root.setThemes([
	am5themes_Animated.new(root)
	]);


	// Create chart
	// https://www.amcharts.com/docs/v5/charts/xy-chart/
	var chart = root.container.children.push(am5xy.XYChart.new(root, {
	panX: true,
	panY: true,
	wheelX: "panX",
	wheelY: "zoomX",
	pinchZoomX:true
	}));

	// Add cursor
	// https://www.amcharts.com/docs/v5/charts/xy-chart/cursor/
	var cursor = chart.set("cursor", am5xy.XYCursor.new(root, {}));
	cursor.lineY.set("visible", false);


	// Create axes
	// https://www.amcharts.com/docs/v5/charts/xy-chart/axes/
	var xRenderer = am5xy.AxisRendererX.new(root, { minGridDistance: 30 });
	xRenderer.labels.template.setAll({
	rotation: -90,
	centerY: am5.p50,
	centerX: am5.p100,
	paddingRight: 15
	});

	var xAxis = chart.xAxes.push(am5xy.CategoryAxis.new(root, {
	maxDeviation: 0.3,
	categoryField: "category", //add your field name
	renderer: xRenderer,
	tooltip: am5.Tooltip.new(root, {})
	}));

	var yAxis = chart.yAxes.push(am5xy.ValueAxis.new(root, {
	maxDeviation: 0.3,
	//min: 0,
	renderer: am5xy.AxisRendererY.new(root, {})
	}));


	// Create series
	// https://www.amcharts.com/docs/v5/charts/xy-chart/series/
	var series = chart.series.push(am5xy.ColumnSeries.new(root, {
	name: "Series 1",
	xAxis: xAxis,
	yAxis: yAxis,
	valueYField: "value", //add your field name
	sequencedInterpolation: true,
	categoryXField: "category", //add your field name
	tooltip: am5.Tooltip.new(root, {
	labelText:"{valueY}"
	})
	}));

	series.columns.template.setAll({ cornerRadiusTL: 5, cornerRadiusTR: 5 });
	series.columns.template.adapters.add("fill", function(fill, target) {
	return chart.get("colors").getIndex(series.columns.indexOf(target));
	});

	series.columns.template.adapters.add("stroke", function(stroke, target) {
	return chart.get("colors").getIndex(series.columns.indexOf(target));
	});

	// Set data
	//static data
	/*
	var data = [{
	  country: "USA",
	  value: 2025
	}, {
	  country: "China",
	  value: 1882
	}, {
	  country: "Japan",
	  value: 1809
	}];
	*/

	//dynamic data pass
	var chart_data = [];
	for(var i = 0; i < response.data.length; i++)
	{
	chart_data.push({
	"category" : response.data[i].category,
	"value"  : parseInt(response.data[i].value)
	});
	}
	console.log(chart_data);

	xAxis.data.setAll(chart_data);
	series.data.setAll(chart_data);

	// Make stuff animate on load
	// https://www.amcharts.com/docs/v5/concepts/animations/
	series.appear(1000);
	chart.appear(1000, 100);

	}); // end am5.ready()

	}
	else
	{
	alert(response.msg);
	}
	},
	error: function (xhr, status) {
	console.log('ajax error = ' + xhr.statusText);
	alert(response.msg);
	}
	});

}
//--- END
</script>
Step 4: Here we are using CodeIgniter framework so we will write below code but if you are using simple PHP or another framework then write code on your own way.
Write below code in your controllers file
    function get_expense_report()
    {
	   $this->chart_model->get_expense_report();
    }
Step 5 : Now finally get data from the table and send the json format response
write below function in model file
        //start function
	function get_expense_report(){

		$query_data=$this->db->query("SELECT t1.exp_date as category,
		SUM(t1.amount) as value
		from expense_master t1
		where t1.delete_status='N'
		GROUP BY t1.exp_date
		ORDER BY t1.exp_date desc
		LIMIT 5");

		$rowcount = $query_data->num_rows();

		if ($rowcount != 0) {

			$data = array(
				'status' => true,
				'msg' => 'successfully',
				'rowcount' => $rowcount,
				'data' => $query_data->result()
			);

		}
		else
		{
			$data = array(
				'status' => false,
				'msg' => "Record(s) not found."
			);

		}
		echo json_encode( $data );
    }
	//end function
By using above code we need json format as below.