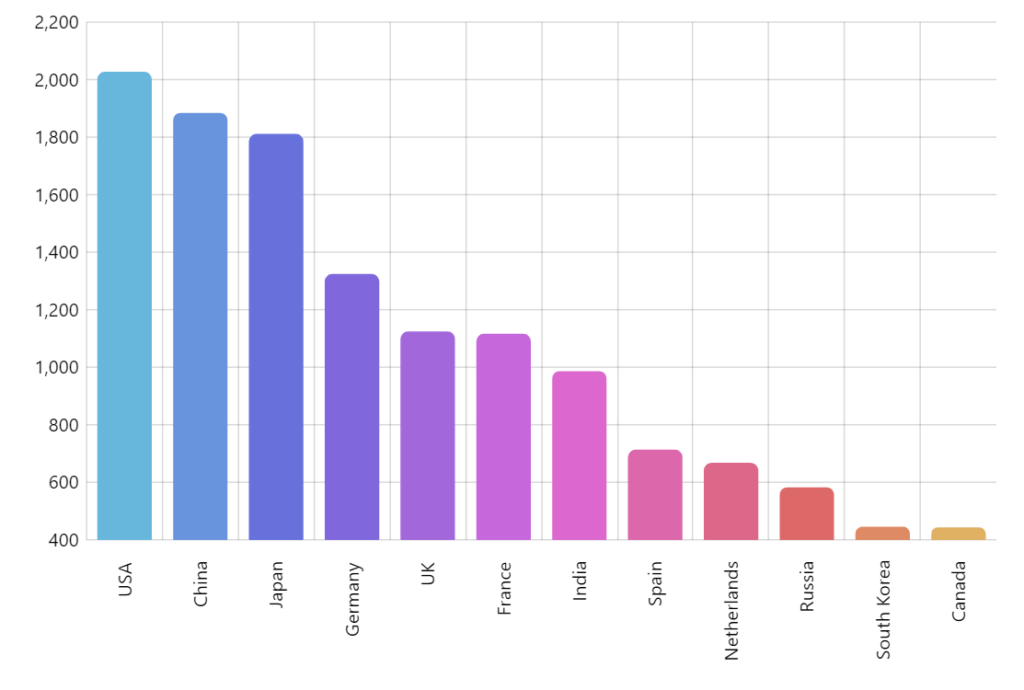
In this demo, we create a simple column chart by using amCharts.
Follow the steps to add a column chart on a webpage:
Step 1 : Start with a simple basic web page. Add a “div” element with the id “chartdiv”:
<div id="chartdiv"></div>Step 2 : Adding a reference. Add a reference to the Chart API at amcharts.com.
<!-- Styles -->
<style>
#chartdiv {
  width: 100%;
  height: 500px;
}
</style>

<!-- Resources -->
<script src="https://cdn.amcharts.com/lib/5/index.js"></script>
<script src="https://cdn.amcharts.com/lib/5/xy.js"></script>
<script src="https://cdn.amcharts.com/lib/5/themes/Animated.js"></script>
Step 3 : Add a JavaScript function.
<!-- Chart code -->
<script>
am5.ready(function() {

// Create root element
// https://www.amcharts.com/docs/v5/getting-started/#Root_element
var root = am5.Root.new("chartdiv");


// Set themes
// https://www.amcharts.com/docs/v5/concepts/themes/
root.setThemes([
  am5themes_Animated.new(root)
]);


// Create chart
// https://www.amcharts.com/docs/v5/charts/xy-chart/
var chart = root.container.children.push(am5xy.XYChart.new(root, {
  panX: true,
  panY: true,
  wheelX: "panX",
  wheelY: "zoomX",
  pinchZoomX:true
}));

// Add cursor
// https://www.amcharts.com/docs/v5/charts/xy-chart/cursor/
var cursor = chart.set("cursor", am5xy.XYCursor.new(root, {}));
cursor.lineY.set("visible", false);


// Create axes
// https://www.amcharts.com/docs/v5/charts/xy-chart/axes/
var xRenderer = am5xy.AxisRendererX.new(root, { minGridDistance: 30 });
xRenderer.labels.template.setAll({
  rotation: -90,
  centerY: am5.p50,
  centerX: am5.p100,
  paddingRight: 15
});

var xAxis = chart.xAxes.push(am5xy.CategoryAxis.new(root, {
  maxDeviation: 0.3,
  categoryField: "country",
  renderer: xRenderer,
  tooltip: am5.Tooltip.new(root, {})
}));

var yAxis = chart.yAxes.push(am5xy.ValueAxis.new(root, {
  maxDeviation: 0.3,
  renderer: am5xy.AxisRendererY.new(root, {})
}));


// Create series
// https://www.amcharts.com/docs/v5/charts/xy-chart/series/
var series = chart.series.push(am5xy.ColumnSeries.new(root, {
  name: "Series 1",
  xAxis: xAxis,
  yAxis: yAxis,
  valueYField: "value",
  sequencedInterpolation: true,
  categoryXField: "country",
  tooltip: am5.Tooltip.new(root, {
    labelText:"{valueY}"
  })
}));

series.columns.template.setAll({ cornerRadiusTL: 5, cornerRadiusTR: 5 });
series.columns.template.adapters.add("fill", function(fill, target) {
  return chart.get("colors").getIndex(series.columns.indexOf(target));
});

series.columns.template.adapters.add("stroke", function(stroke, target) {
  return chart.get("colors").getIndex(series.columns.indexOf(target));
});


// Set data
var data = [{
  country: "USA",
  value: 2025
}, {
  country: "China",
  value: 1882
}, {
  country: "Japan",
  value: 1809
}, {
  country: "Germany",
  value: 1322
}, {
  country: "UK",
  value: 1122
}, {
  country: "France",
  value: 1114
}, {
  country: "India",
  value: 984
}, {
  country: "Spain",
  value: 711
}, {
  country: "Netherlands",
  value: 665
}, {
  country: "Russia",
  value: 580
}, {
  country: "South Korea",
  value: 443
}, {
  country: "Canada",
  value: 441
}];

xAxis.data.setAll(data);
series.data.setAll(data);


// Make stuff animate on load
// https://www.amcharts.com/docs/v5/concepts/animations/
series.appear(1000);
chart.appear(1000, 100);

}); // end am5.ready()
</script>